

Based on the initial results, it appears that the logjam might not be broken, and Democrats will survive and not head towards a lame-duck session.
The most significant issues on voters' minds, apart from the Roe vs. Wade debate, were the economy/inflation, climate change, healthcare, and public safety.
These tie back into Florida, where the biggest issues for domestic insurers are climate change, loss cost inflation, and the broader economy. After several years of above-average catastrophe losses, an adverse legal climate resulting in higher-than-average losses from AOB, roofing & sinkhole fraud, the market waited with bated breath for Hurricane Ian to pass.
Will they survive or won't they survive was a common theme? Three carriers remain relevant on the publicly traded side, while UPC and FedNat get close to crossing over.
For this group, 2022 has been a pivotal year, as several issues which have plagued the marketplace remain front and center. And though we are barely out of Ian’s shadow, we had Hurricane Nicole approaching last night.
Taking a step back, one might wonder how the marketplace was doing before these historic catastrophes. Our note looks at the performance in several metrics over time, and it’s clear that the market had struggled with underwriting profitability even when the seasons were not severe.
This likely implies that apart from risk management challenges, the state tort climate is also to blame for unfavorable results.
These multiple poor-performing years have also pressured the capital backing the risk, with several smaller capitalized players making up the marketplace. Perhaps some background here would help.
In a prior note we highlighted how the lack of adequate pricing forced the larger nationals out of the marketplace. This led to “the great Florida experiment” and allowed several smaller companies with less capital to step in.
This experiment hasn’t really succeeded as the group’s lackluster underwriting has intersected with the need for shoring up balance sheets. With new capital not forthcoming, the leverage ratios (a measure of balance sheet backing business written) have worsened over time.
With reinsurance in short supply, or being prohibitively expensive at renewals, Florida insurers will be forced to pare down their leverage as we continue to see non-renewals and pullbacks.
But all is not doom and gloom, and if Nicole turns out to be a manageable event, some carriers will survive, albeit further weakened. One of the lessons of adverse results in Florida has been: do not keep all your eggs in one basket.
This note will show initial attempts for carriers to diversify away some of their risk. Is it a case of too little too late for some? Probably, but it’s a good first step.
First, a quick detour on quarterly results before discussing the longer-term performance challenges and shifts over time.
In terms of the third quarter earnings, EPS was down across the board, as would be expected given the severity of Ian.
Loss ratios and combined ratios were similarly affected by Ian, with massive increases. HCI had the largest increases, with loss ratio jumping 64.2pts to 130.7%, and combined ratio up 65.1pts from 112.2% to 177.9%. Heritage was the least scathed, with a loss ratio increase of 17.8pts to 97.6% and the combined ratio increasing 20.8pts to 133.3%.
On a more positive note, almost all carriers were up in premium, showing increases from 10% to nearly 16% with the exception being UPC. This increase is more noteworthy given the significant reduction in policies disclosed by Universal and Heritage (meaning the increase was even greater on the renewal book).
The group had good gains in net investment income, with HCI jumping from $2.5mn to $18.5mn due to the sale of part of their property portfolio.

One thing we saw across the board was worsening book values, with some carriers being almost cut in half, mostly from an uptick in losses and, to some extent, from the mark-to-market impact. The chart below shows the change in book value since the end of 2017 for each carrier.

For UPC, this drop (85% over around five years) started in 2020, but for the others it has been somewhat more recent, with HCI in particular actually up 40% less than a year ago, and now down 12%.
Looking at more recent change, all four carriers lost at least a quarter of their book value this quarter alone, with UPC topping the list at -52%. Compared to one year ago, Heritage has lost 69%, and UPC 75%.
This note will look at underwriting performance, leverage, and whether the shifting business has aided carriers.
Firstly, underwriting performance was already becoming an issue before successive cats
The industry has had a series of bad years, with major hurricanes exceeding forecasts and breaking records. Knowing that, and knowing about how these events are worsened by bad players taking advantage with AOB fraud etc., it’s no wonder that Florida-concentrated carriers have taken a hit.
That said, there has been an implication that these external factors are the exclusive culprits, which is not the case. They have certainly contributed more than their fair share to the current state of affairs, but the reality is that many carriers were on unstable ground before these events started in 2017 with the triple cat event of Harvey, Irma, and Maria (H-I-M).
We decided to look at underwriting performance over time, to see how the narrative played out when compared to our expectations.
For all the analyses in this note, we have selected a group of carriers, both public and private, that represent the major players in Florida, combining factors including market share, concentration within Florida, and surplus. Some carriers are excluded due to data quality. We will call these our “Florida cohort” for our purposes here.
To gauge the underwriting performance of the Florida cohort, we looked at combined ratio over time. While the numbers for 2017 to present are clearly much higher than before, we can also see that for many carriers, the losses were already starting to tick up before the onslaught of hurricanes in 2017 with H-I-M.
Homeowners/farmowners combined ratios for select Floridians 2004 to 2021

Note: Southern Fidelity is in liquidation (myfloridacflo.com)
Source: S&P Capital IQ, Inside P&C
There was a period of improvement in 2013 to 2014, but numbers began to slide in the two years leading up to H-I-M. While there were cat losses during that time, it was not on a scale to cause the 20+ point shifts seen in the numbers above.
To get another perspective on the issue, we examined prior period development (PPD). The chart below shows PPD for the Florida cohort over time, with H-I-M and Michael indicated in 2017 and 2018 respectively.
Homeowners/farmowners prior period reserve development for Florida cohort

Note: Farmowners is negligible
Source: S&P Capital IQ, Inside P&C
While several carriers show unfavorable development during that time, which is what we would expect due to the size of the events, some have adverse development in the prior years.
In this case, Universal shows a positive trend, with developments near zero in the earlier years (meaning their reserves were almost exactly what they needed to be), with the expected uptick after H-I-M and Michael, then drifting back down.
However, this trend does not extend to the rest of the cohort, which show sporadic swings in both directions, randomly distributed over time. For example, HCI had 9.2% adverse development in 2016.
Overall, we would expect the adverse development, but hope to see a winding down in 2020 and 2021. Instead, it seems the companies are more all over the place than they were in the previous years.
Looking at combined ratios and prior-period development, it is clear that there were some underlying issues including AOB and sinkholes. In other words, this is both a risk management and a structural problem with no easy answers.
Secondly, looking at leverage shows that balance sheets are under pressure
One way to judge the level of capital adequacy is to look at the premium leverage ratio. In past analyses we have solved for the sensitivity of results to pricing errors in the book. In other words, a higher leverage (higher amount of business compared to capital base) would magnify these errors if the company has combined ratio >100%.
Yes, leverage differs for different industry segments, but a rising leverage can be a sign of optimal deployment up to a certain point, and after that reflects an under-pressure capital base.
The chart below shows NPW to surplus for the Florida cohort with major hurricanes indicated. We picked a simplistic 1.5x barrier for a multiline homeowners’-predominant carrier as a benchmark.
Overall NPW to surplus for select Floridians 2004 to 2021

Note: color formatting range ends at 3.8 to avoid UPC 2004-2005 outliers distorting the range
Source: S&P Capital IQ, Inside P&C
There is some noise in the earlier years as companies start out, but by 2014 it is fairly stable. And despite the noise, the median and weighted average gives a clearer picture of the overall industry trend, showing that the group was hovering around that 1.5x number.
Now, after several years of successive larger-than-anticipated cats, we see many of the carriers turning pink, with a clear uptick in 2020 and 2021 in the median and average. This shift means it is not just a couple of outliers anymore, but a full industry shift.
This self-graded exam shows that no easy solutions exist for Floridians. Do investors add more capital or do they wait for things to get worse and force the regulators’ hand?
For the individual companies, this over-extension is concerning, but it is this median/average drift that is more concerning on a large scale. In other words, The Great Florida experiment of picking domestics and depopulation companies over strongly capitalized nationals has failed.
Thirdly, smaller shifts in the underlying book are adding up to visible improvements
While the talk about Ian and the economy was expected, the one thing that stood out this season was the subtle change in business that some of these carriers are undergoing. Universal and Heritage in particular noted their non-Florida business, which is something that has been in prior releases but has been overshadowed by larger issues.
This quarter, the shift caught our eye, and we wanted to see if it is possible that the shifts could help these carriers survive.
The first shift is increasing the out of state business. The non-Florida premiums are quite small in comparison with the Florida book ($.3bn vs. $1.5bn), but they are growing, and though the premium is small, the policy count and TIV indicate Universal actually has a decent foothold.
The chart below shows the percentage of business that each member of the cohort is doing in Florida. While some have kept 100% of their business through thick and thin, we can see that Universal in particular has been moving beyond the borders.
Shift in premium from Florida to out of state (% of HO premium in FL)
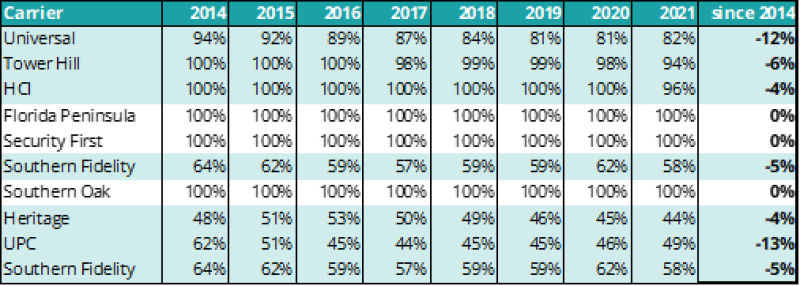
Source: S&P Capital IQ
Depending on the quality of the book and how much they continue with this strategy, it could be a very effective hedge and allow them to continue where others stumble. There is of course an element of fortuity in this – for some carriers who wrote across both Louisiana and Florida, the 2020-21 hurricane losses in that state hindered them.
Another interesting change has been the movement away from the coast. Of course, this makes sense with everything going on, but we wanted to quantify it and see what the change looks like.
The chart below shows the carriers’ volume of lawsuits for coastal counties in 2017 and 2021 as a percentage of their total lawsuits received (see our prior note for a full list of caveats). The coastal areas might have seen more frequent legal action due to their exposure, meaning their coastal market share may be lower than stated here, so this is intended to show the shift rather than the actual concentration.

So, with these changes, the question is: are they having any effect? While this will take years to fully play out and is subject to the unpredictable forces of weather and the economy, we can do a simple check to get an idea of the impact in the moment.
The chart below shows a comparison of the financial situation during Irma, the most recent major Florida loss hit before Ian, compared to now, with Ian. The companies’ net Irma losses are shown as a percentage of shareholders’ equity at the time to give a sense of their magnitude. Naturally, it is worth bearing in mind the steep loss development that went on to occur with Irma, which initially seemed a smaller scale event than Ian.
To the right, we show net Ian losses, and their percentage of Q2 shareholders equity. Although a simplistic comparison, it shows that much work needs to be done if carriers want to rebalance their exposure away from hurricane loss risk.

In summary, while successive hurricanes have taken their toll, the underwriting performance was not ideal before they began. With the macroeconomic backdrop worsening and Nicole on the horizon, carriers will need to really dig themselves out of this hole to remain relevant. Unfortunately, for some, it will be too late.