
With the changes in the economic climate, including Russia’s invasion of Ukraine, it is uncertain what impact this will have in impacting the longer-term demand and supply dynamic. Our recent note on miles driven showed that economic conditions were a more significant determinant of cycle turns vs. a static rise in gas prices.
There has been discussion of similarities and dissimilarities in this cycle vs. others and any interesting reserving trends on many conference calls.
Using CPI data as a proxy, as shown in our last note, several items related to property damage continue to rise to some of the highest numbers seen historically. In addition, personal auto insurers also have to contend with regulatory pressure when attempting to raise prices. But in all this, what is forgotten is that pre-Covid, the industry was witnessing some of the best trends.
It is easy to catastrophize the current climate, but the industry is still performing better on a multi-decadal basis.
The note below looks at historical paid-to-incurred trends for the industry, historical trends on a group basis, and quarterly trends and rate change.
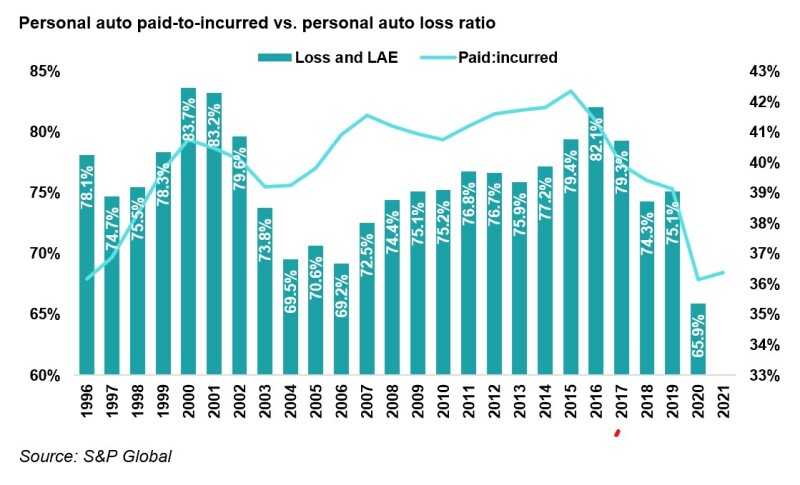
Firstly, a rising paid-to-incurred ratio was an indicator of a cycle turn.
Although there are myriad data points to use to opine on the strength or deficiencies of reserves, one of the indicators that can be used is the level of paid losses to incurred losses. If reserves are adjusted appropriately, the paid pattern should also change accordingly. However, if companies are slow or fast in recognizing trends, the paid-to-incurred ratio can be a leading indicator for a cycle change. A rising paid-to-incurred worsening faster than the loss ratio during the same period could be viewed as a negative, if one were to simplify this argument.
We looked at historical trends going back to the 1990s. The chart below shows a rising paid-to-incurred was followed by a worsening loss ratio trend. This pattern was recently repeated in the mid-2010s, where an increasing trend preceded worse results and pricing action, which ultimately led to good results and declining rates.
A similar trend played out in the mid-2000s as well. However, what remains of interest is that the paid-to-incurred trends haven’t rebounded sharply and are only modestly up after declining to a near-all-time low in 2020 due to Covid. This situation can play out in one of two ways: either the industry has been much faster in reacting to the trends and this cycle turn will be less intense, or there is a lot more pain to come. We remain in the first camp.
Secondly, a look at group numbers exhibits similar trends.
Taking a step back, we also looked at trends for the most significant players over time to consider competitive behavior. Although recently, some companies such as Kemper have reported outlier results compared to the peer group, the overall picture appears stable.
That said, some names’ paid-to-incurred ratios are low vs. historical trends. Although too early to make a call on reserves, due to changing nature of books over time a simple expectation would be that the industry has been responsive in reacting sooner.
Historical trends for top personal auto groups (%)

Source: S&P Global
The table below shows paid-to-incurred trends from 2010 to 2000.

Source: S&P Global
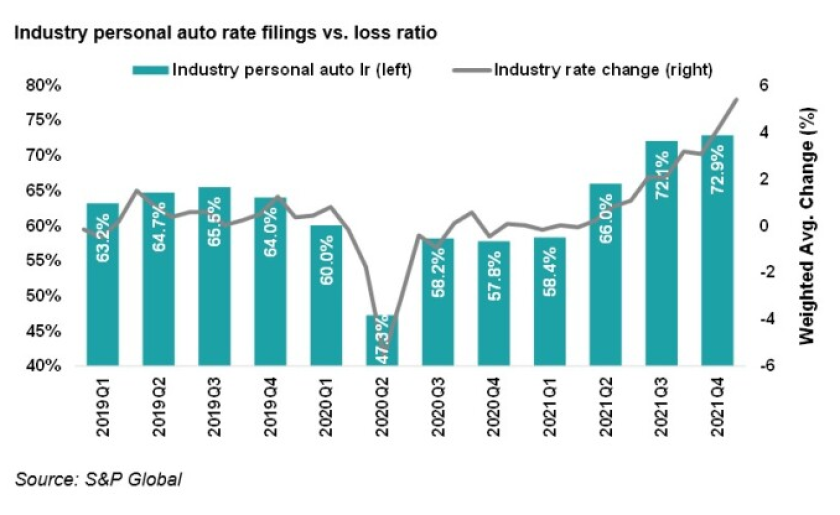
Thirdly, the industry seems to be diligent in its rate pursuit.
Having covered the space for a long time, we have often seen a reluctance from insurers to recognize the changes in loss trends and implement rate change. However, over the past two years we have seen strong responsiveness from the industry in pursuing rate action.
The quarterly loss trend below pre-Covid and minimal rate action is of interest. We can see the industry springing into action in terms of rate on the right side of this chart. Note that this is an average rate change. On a state/region basis, rate changes can often be as high as double-digits in response to the change in loss cost trends.

The table below shows the top personal auto players' quarterly loss. Without getting into naming names, it does show who might have been late in recognizing the shifting loss trends. We acknowledge that the analysis below compares agency with direct players, so it's not a perfect comparison. A relative view might indicate that insurers who were unconvinced that the changing loss cost trends from a rising severity would persist. On the other hand, insurers who reacted swiftly, such as Progressive, will likely be ahead of the curve when we emerge from this cycle.
Personal auto quarterly loss ratio

Source: S&P Global
In summary, our analysis above shows that the industry has been reacting quickly with rate action, even though the paid-to-incurred trends remain relatively flat vs. past cycle turns.