
Our note today focuses on the recently filed 2022 personal lines statutory data. And we hope it is a welcomed break from the will-they-wont-they Fed and bank-related drama.
Below we will examine personal auto and homeowners’ results in a historical context and make mention of the largest players, results by state, and comment, briefly, on regulatory conditions.
Firstly, personal lines saw historically challenging results for 2022, but it could be the bottom
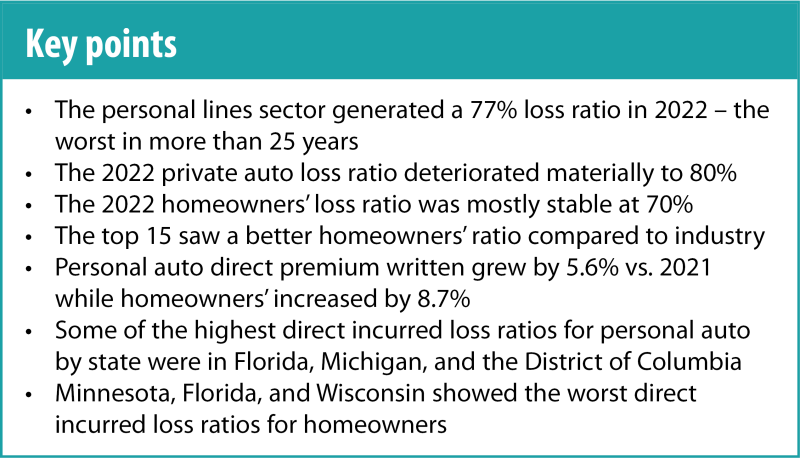
The recently released 2022 statutory data reveals the highest personal lines loss ratio in more than 25 years! No single year has generated a worse loss ratio than the 2022 result of 77% since 1996 – the first year of stat data recorded by S&P Capital IQ. The next highest personal lines loss ratios were 2001 at 73%, and 2017 at 70%.
As shown in our Q3 2022 stat note, most of the noise for the personal auto and homeowners’ lines of business came in Q2 and Q3 of last year from catastrophes and loss cost inflation.
With insurers taking aggressive rate action (more on that below), and Hurricane Ian’s losses developing better than expected, the worst of it might be in the rear-view mirror.
The following table shows 2021 and 2022 premium and loss ratios for both homeowners and personal auto, as well as all personal lines of business.

We can see in the table that there was growth for the industry in both homeowners and personal auto, with direct written premium up 8.7% and 5.6%, respectively. Loss ratio results were mixed, with homeowners’ improving slightly for the top 15 but flat for the industry, and personal auto worsening by 12pts for both the top 15 and the industry overall.
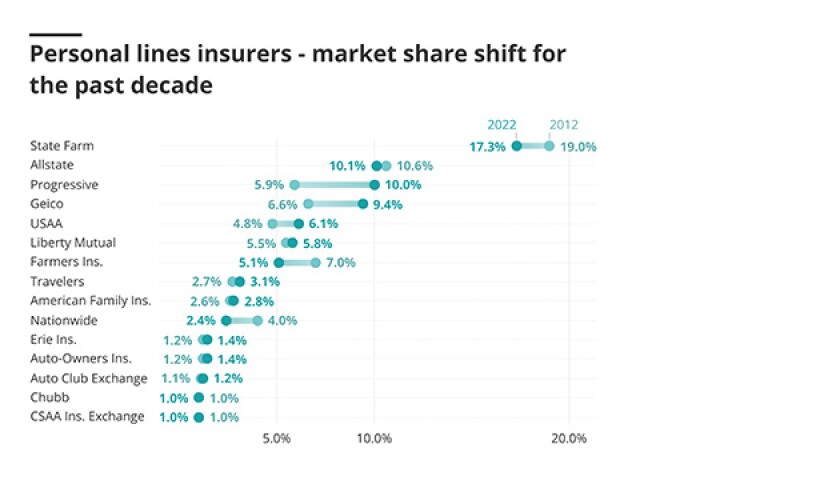
Noting that the top 15 hold 78% of the total market share (a higher concentration than any other line), we looked at market share over the past decade to see if they had shifted.
The chart below shows the 2012 and 2022 market share for the top 15 personal lines insurers. The light teal circle shows the carrier’s market share in 2012; the darker teal circle shows the carrier’s market share in 2022.
We can see there has not been much of a shift during this time. Market share has declined for State Farm, but they are still the largest personal lines insurer and have had a sizeable lead on everyone else for a long time. Progressive and, to a lesser extent, Geico have made the largest advances in market size in the past 10 years, with Progressive now neck-and-neck with Allstate.
The chart below shows the premium for personal lines vs commercial lines, along with yearly growth rates. We see that personal lines growth has returned to ~6% per year in the two years since the pandemic driven reduction in top-line (from rebates/discounts/premium returns).

Both sub-sectors are responding to their own cycles. Personal lines could continue to grow from pricing actions while commercial growth will slow down as it climbs down from peak pricing levels.
Secondly, state-level results reflect state-level challenges
Profitable underwriting is no easy task, and each state’s particular set of laws and regulations can put additional strain on insurers, in addition to state-specific catastrophes.
The following map shows 2022 direct incurred loss ratios for homeowners by state. The gray represents lower loss ratios and darker teal represents higher loss ratios.
Florida has a 122% loss ratio, primarily due to Hurricane Ian. We have explored the policymaking difficulties that exacerbate hurricane losses in Florida in a number of prior notes.
In the northern part of the country, particularly in Minnesota and Wisconsin, loss ratios spiked to historical highs – 161% in Minnesota and 111% in Wisconsin. This is largely attributable to hailstorms.
Below we have the same chart for personal auto, showing the loss ratio by state. The gray represents lower loss ratios and darker teal represents higher loss ratios.
As expected, we see higher loss ratios in states with more dense population centers. Florida insurers and insureds can’t seem to catch a break with its state leading the pack in both auto and homeowners’ losses.
We have previously discussed the difficulty in California, with regard to auto insurers, and insurers will try to regain rates and/or be forced to thin their exposures.
Lastly, if inflation eases, we can return to the discussion on margin improvement
There is still a big “if” regarding the future of inflation. However, insurers have been taking rate action to position themselves to get the loss costs under control.
The following chart shows 15 years of homeowners’ premiums, loss ratios, and the weighted average rate change taken.

On an industry level, direct incurred loss ratios for homeowners remain elevated but stable over the past several years, as the industry grapples with the new normal of elevated catastrophe losses.
Switching to the larger auto insurance line of business, there’s significantly more volatility as we look back at 15 years of premiums, loss ratios, and the weighted average rate change taken.

We see in the chart above that only premium growth has been steady. The other two metrics have seen significant swings – most notably the drop in losses, and rate changes going sharply negative (reflecting lack of driving) in 2020. This, of course, was immediately followed by the most dramatic rise in rates and loss ratios in recent memory.
We know that not all personal lines insurers responded equally to the changing inflationary climate, so we will likely see shifts in market share percentages as some carriers thin exposures while others are free to pursue growth.
In summary, in 2022 catastrophes and auto loss cost inflation drove one of the worst personal lines industry loss ratios in many years. State-specific results varied due to differences in regulation, and regionality of these catastrophes. However, with the Fed potentially nearing the peak of the rate cycle, we hope to see a slowing of underlying loss trends.
Appendix:


